FBI Hate Crime Data, Patterns & Analysis- A National Examination
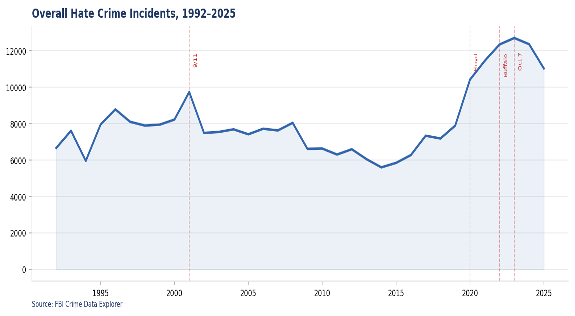
Overal Hate Cime Incidents, 1992-2025
By Brian Levin & James Nolan; with McKenna Lausch and Darrel Claybrook
California Association of Human Relations Organizations
Article link: Microsoft Word – Draft-hate_crime_essay_v12.2.2
Hate in America: A Decade of Escalation & Records, 2026 Up After Recent Crest
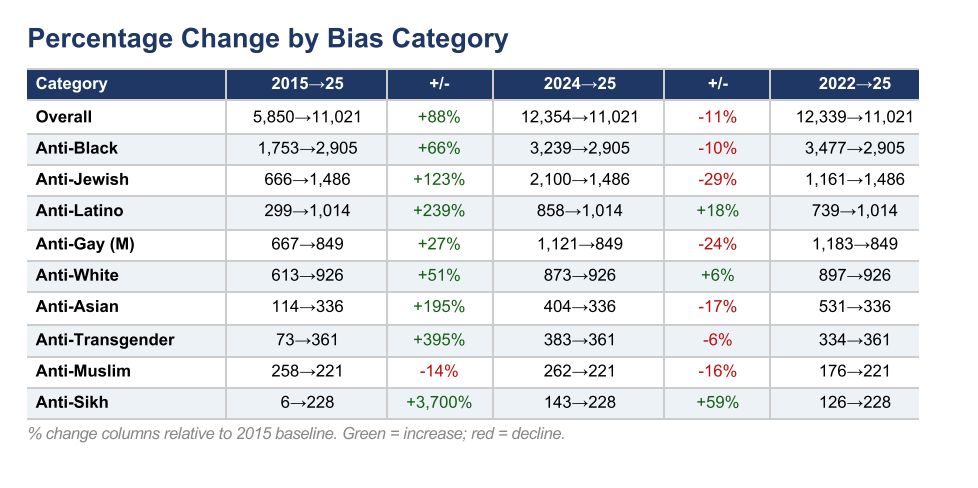
The decade from 2015 to 2025 produced the most sustained surge in FBI reported U.S. hate crime since federal tracking began in 1991. Reported incidents rose from 5,850 in 2015 to 11,021 in 2025 — an increase of 88 percent, despite an annual overall drop of 10.8 percent last year in preliminary unofficial Federal Bureau of Investigation data, that offers a glimpse into trends likely to be reflected in their official version produced later this year.
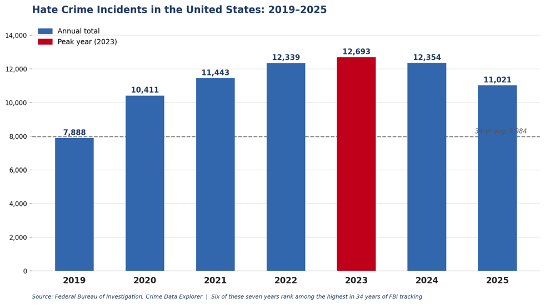
Despite a decline, 2025 ranks as the 5th highest year for hate crime in the 34 year history of federal FBI collected police data – registering higher than any year prior to the 2020s – which non-consecutively stacked the six highest years on record. In 2025, most FBI categories moderated off their 2023–24 peaks, with the notable exceptions of anti-Latino and anti-Sikh crimes, as both reached all-time annual records in 2025, and overall aggravated bias assaults.
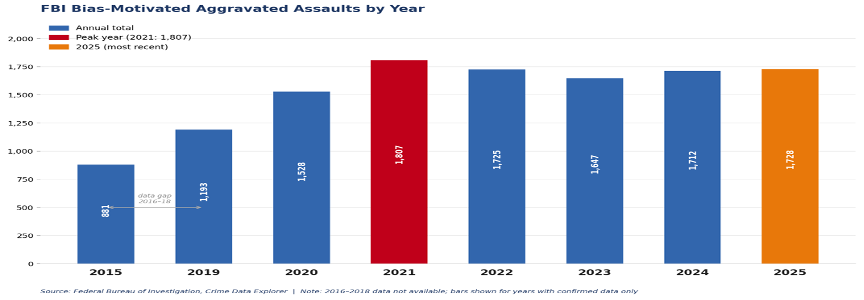
As hate crime incidents fell from a near record high of 12,354 in 2024 to 11,021 in 2025, the most violent of hate crimes rose last year as both homicides and aggravated assaults increased. At a time when overall violent crime is falling to multi-decade lows, aggravated hate crime assaults edged up – by one percent, to 1,725 – enough to register as the second highest annual level ever with a total roughly double the level of 2015. Overall, 2025 ranks as the 5th highest year for hate crime in the 34 year history of federal FBI collected police data. Last year’s total far exceeds the long-run annual average of 7,900; with the 2025 figure 40 percent above that mark.
In other data, early and year to date 2026 preliminary hate crime reports posted on state and municipal portals were generally up across some limited sample cities, as New York, Houston, Phoenix, Seattle, Denver, Kansas City, MO and Los Angeles rose, but notably Chicago, Philadelphia, Las Vegas and Washington, DC declined.
FBI and other data going back to the 1990s reveal two important patterns:
- this decade’s first half represent a new historically elevated, more violent and diversified era for hate crime, likely influenced by geo-political conflict, divisive politics and increasingly unmoderated and exploited online spaces.
- recent sharp hate crime spikes around catalyzing events — terror attacks, police confrontations, COVID-19, war and geo-political conflict, mass shootings, and political polarization – upon receding, do so only partially and more slowly, to historically elevated baselines, far higher than before, and often decoupled from overall crime trends.
Moreover, most recently, the 2025 declines in hate crimes appear to havelagged those in violent crime generally. While official full year 2025 FBI totals are not yet published, an analysis of overall violent crime by the Council on Criminal Justice in a sample of major American cities generally showed more precipitous declines in violent crimes, than this report on hate crimes; as homicides dropped 21 percent, robberies by 23 percent and aggravated assault by nine percent to levels not seen in decades.
The 2025 hate crime totals came off recent record years; exceeded only by 2023 (12,693), 2024 (12,354), 2022 (12,339), and 2021 (11,443). Moreover, this last decline was unevenly distributed. Three categories — anti-Latino, anti-Sikh, and anti-White — actually rose from 2024 to 2025, two of them reaching records. The overall number fell largely because anti-Jewish, anti-Black and anti-Gay (Male) incidents moderated substantially from their recent annual peaks earlier this decade, though to plateaus far above baselines of prior decades.
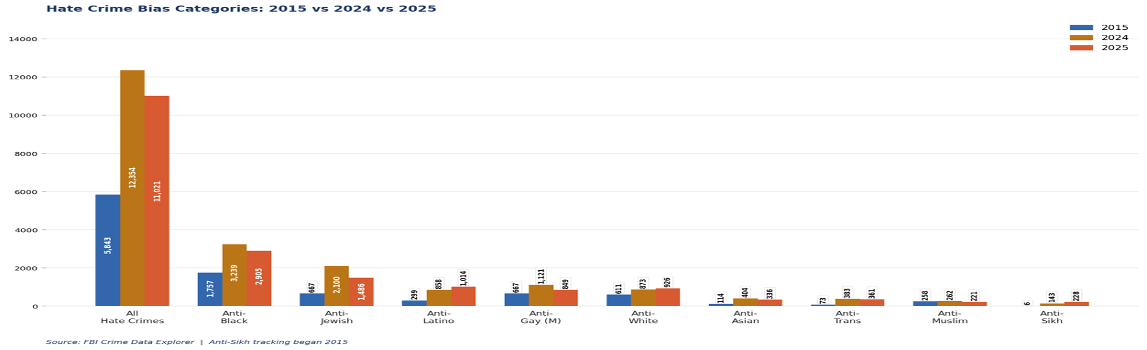
The 2024-to-2025 changes reveal a split pattern that warrants attention. Multiple categories declined year-over-year from previous increases — led by anti-Jewish (−29 percent), anti-Gay Male (−24 percent), anti-Asian (−17percent), and anti-Muslim (−16 percent) — as the extended post-October 7 elevation began to moderate. Two categories, however moved sharply in the opposite direction: anti-Sikh (+59 percent, a decade high), anti-Latino (+18 percent, all-time record), as well as anti-White (+6%). The divergence underscores that hate crime trends are not monolithic: different communities face distinct and shifting threat environments and spikes, driven by separate political, social, and demographic pressures.
From 2024 to 2025, anti-Black incidents declined 10.3 percent from 3,239 to 2,905 — the second consecutive annual decrease from a non-record 2023 multi-decade high. Anti-Black hate crime has been the most frequent category every year since federal record keeping began, but a trend of it proportionally shrinking relative to all hate crimes ceased in 2019. The latest overall decline is meaningful, but the floor remains high: the 2025 annual total is 67 percent higher than that of 2015, and most monthly averages this half decade far exceed most months prior to 2019 as seen visually in heatmaps.
The 2025 decline off of 2024’s record year in anti-Jewish hate crime offers a similarly mixed picture. The year saw the sharpest annual decline in the category’s recorded history. Incidents fell 29.2 percent from 2,100 to 1,486 in 2025, as the acute post-October 7 extended domestic religion hate crime surge partially receded with the commencement of the Gaza War ceasefire efforts. Despite the drop, 2025 remains the 3rd highest year ever recorded and sits 51 percent above the 34-year annual average of 987 – almost double the pre-2022 norm, indicating a new elevated baseline rather than a return to pre-Gaza War levels. Moreover, in other data, 2025 was yet another year over this past decade where multiple plots and homicides were directed toward Jews in the United States, something more infrequent in prior decades.
Unlike most other categories, anti-Latino hate crime rose 18.2 percent from 858 in 2024, to a record 1,014 in 2025 — the only major racial or ethnic category to increase from 2024. In 2025 anti-Latino hate crime for the first time ever entered into the top three most targeted groups annually. The murder of 23 Latino Americans at an El Paso Walmart by a white supremacist on August 3, 2019 marked the most fatal modern anti-Latino hate crime. While no single month dominated this record year; nearly every month of 2025 was elevated above any comparable month before 2020, consistent with a structural shift apparently tied to increasingly intensified immigration enforcement rhetoric and practices and negative false stereotyping of Latinos in politics and government.
Anti-Gay (Male) incidents, the fourth most frequent, declined 24.3 percent from a near-record of 1,121 in 2024 to 849 in 2025.
Annual Totals by Bias Category
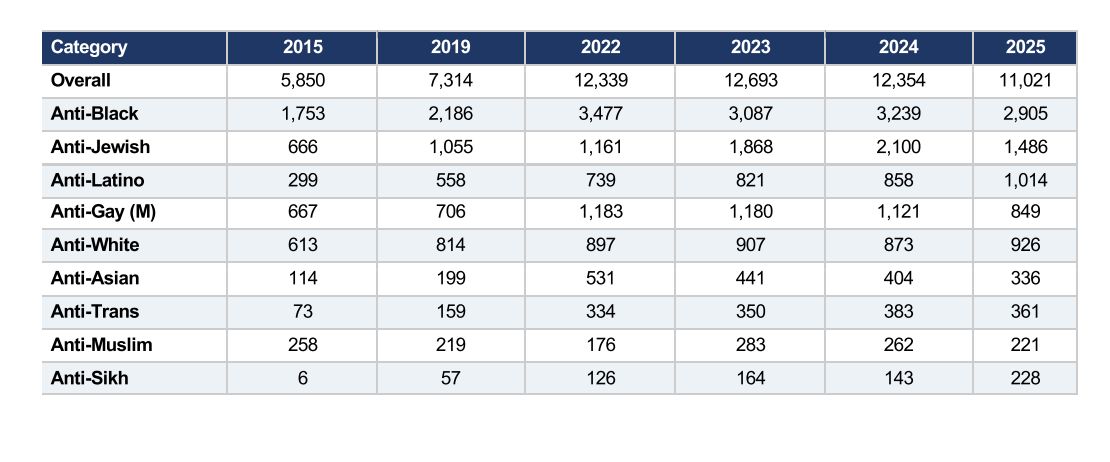
Source: FBI Crime Data Explorer. Anti-Sikh tracking began 2015.
Figure: Bias categories, 2015 vs 2024 vs 2025. Labels show % change from 2015. Source: FBI Crime Data Explorer.
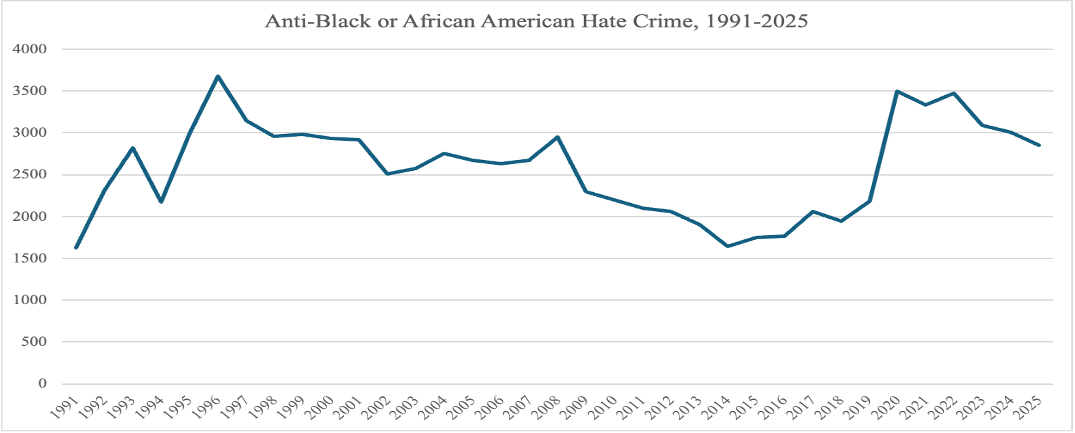
Anti-Black Hate Crime: Most Frequent Every Year
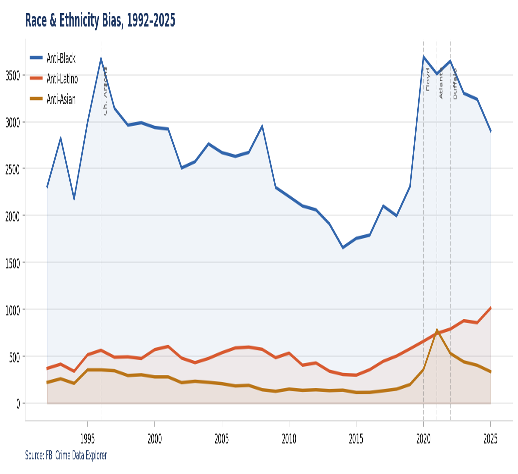
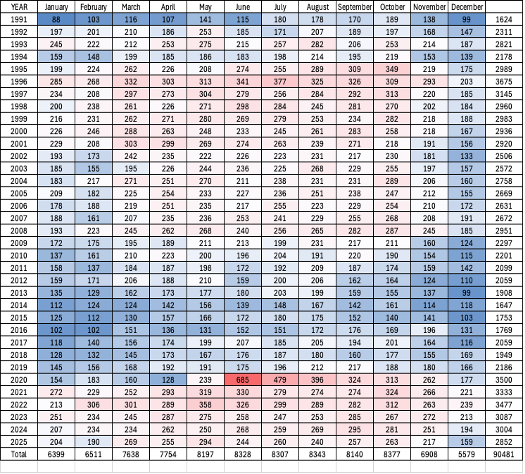
Figure 3: Race and ethnicity bias incidents, 1992–2025. Source: FBI Crime Data Explorer.
Figure 4: Anti-Black monthly heat map. Source: FBI Crime Data Explorer.
Anti-Black hate crime remains the largest category in every year of FBI tracking. From 2024 to 2025, anti-Black incidents declined 10.3 percent from 3,239 to 2,905 but increased 66 percent from 1,745 in 2015. The heat map above reveals various distinct spike periods across 34 years, each with a different correlating event:
May 1992, following the acquittal of LAPD officers involved in the Rodney King beating saw a civil disorder in Los Angeles
and an increase in hate crime, despite a lack of participation from most California agencies.
1996 remains the record year for anti-Black hate crime and July 1996 recorded 377 anti-Black incidents — the 4th highest single month in the 34-year dataset and the highest before the 2020 Floyd-era surge, significantly higher than the long-run mean.
Another correlation to racial hate crime was during the 1995–96 Black church arson surge — when over 140 predominantly Black churches burned across the South in 18 months, the largest wave of such church arsons since the civil rights era. Congress passed the Church Arson Prevention Act on July 3, 1996. October 1995 (349 incidents) correlated to backlash following the OJ Simpson murder acquittal on October 3, 1995. When race became an issue in the 2008 presidential election season, hate crimes rose to the highest annual level of anti-Black incidents for that decade.
June 2020 and the George Floyd Effect
Monthly anti-Black incidents totaled just under 250 in May 2020 before exploding to almost 700 in June, the highest month in any in the entire dataset outside the 9/11 period — following the murder of George Floyd. July saw 496 and August 414 crimes. The category peaked for the decade at 3,500 in 2020 and remained elevated at 3,239 in 2024 before falling to 2,905 in 2025, a level still 14 percent above the 34-year annual average.
The 2025 moderation should be read alongside the May 2022 data, which confirm racial violence was still structurally elevated following the 2020 multi-decade peak. In May 2022, anti-Black incidents reached 371 — one of the highest months in the category outside the 2020 Floyd surge — while the overall monthly total across all bias categories reached 1,190. The most probable driver of both elevations is the Buffalo Tops supermarket shooting on May 14, 2022 where a white supremacist attack killed ten Black people and generated saturation national coverage. The effect carried into June 2022, confirming a multi-month impact consistent with other high-profile racially motivated attacks in the dataset. In 2015, a white supremacist murdered nine African Americans at the Mother Emmanuel church in South Carolina.
Anti-Jewish Hate Crime: Record Event-Driven Surges Decline to Elevated Level
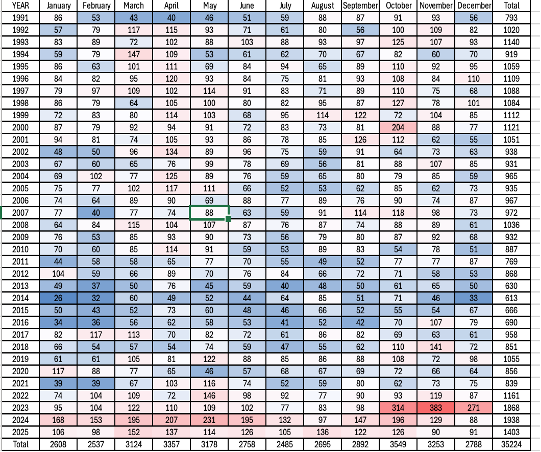
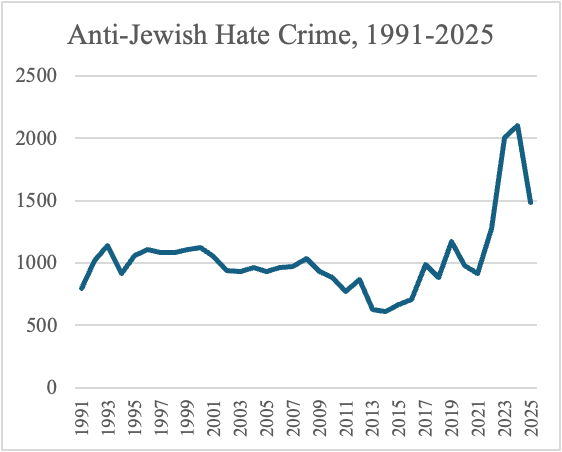
Figure 5: Anti-Jewish monthly heat map. Source: FBI Crime Data Explorer.
Anti-Jewish hate crime rose from 664 in 2015 to 1,486 in 2025 — a 124 percent increase, placing 2025 as the 3rd highest year on record, exceeded only by 2024 (2,100) and 2023 (2,006). The 34-year annual average is 987; 2025 is 51 percent above that baseline. In October 2023 — the month of the Hamas terror attack and start of Israeli military retaliation in the Gaza War — saw incidents spiked to 336, and November 2023 reached 397 — the two highest months ever recorded for anti-Jewish hate crime. Overall monthly hate crime data from 2023 show totals reaching 1,329 in October and 1,273 in November — among the two highest months in the 34-year dataset.
The heat map also captures the recurring pattern of earlier Middle East–driven spikes: March 1994 (147, Late February Hebron massacre and March Brooklyn Bridge student murder), October 2000 (204, Second Intifada outbreak), and October–November 2018 (112/141, Pittsburgh synagogue shooting — whose perpetrator explicitly invoked Jewish organizations’ alleged role in immigration — coinciding with the midterm election campaign).
The 2024-to-2025 change was the sharpest annual decline in the category’s recorded history: anti-Jewish incidents fell 29.2 percent from 2,100 in 2024 to 1,486 in 2025, as the acute post-October 7 surge partially receded. Despite the drop, 2025 remains the 3rd highest year ever recorded and sits 51 percent above the 34-year annual average of 987 — roughly double the pre-2022 norm, suggesting a new, permanently elevated baseline rather than a return to pre-conflict levels.
Anti-Latino Hate Crime: An All-Time Record in 2025
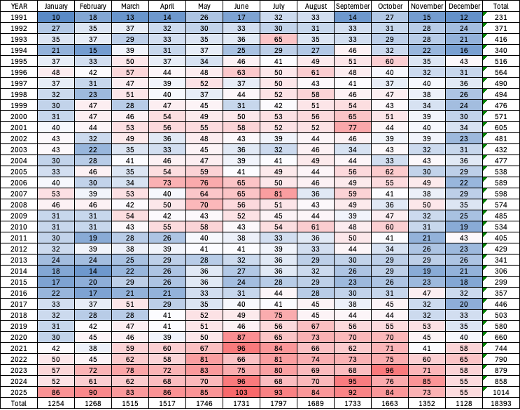
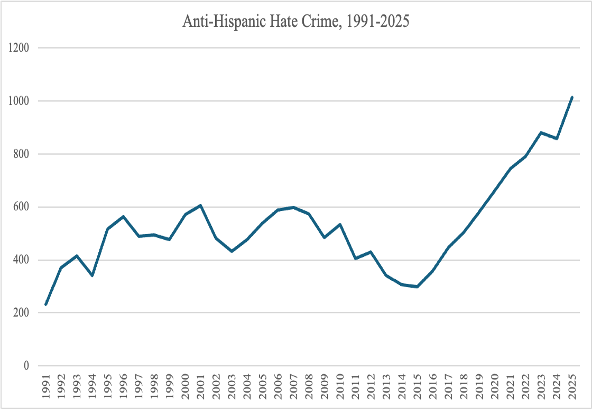
Figure 6: Anti-Latino monthly heat map, 1992–2025. Source: FBI Crime Data Explorer.
Anti-Latino hate crime rose from 299 in 2015 to 1,014 in 2025 — a 239 percent increase and an all-time record, surpassing the previous high of 879 in 2023. The heat map makes the structural shift visible: a broad warming across the grid from 2016 onward, with no single month dominating but a persistently elevated floor across all twelve months of 2025. The August 2019 El Paso Walmart shooting — in which a white supremacist gunman explicitly targeting Latinos killed 23 people — appears as an isolated spike before the broader post-2019 escalation.
Unlike most other categories, anti-Latino hate crime rose 18.2 percent from 858 in 2024 to 1,014 in 2025 — the only major racial or ethnic category to increase from 2024. The heat map shows no single month driving the record; instead, every month of 2025 was elevated above any comparable month before 2020, consistent with a structural shift tied to intensified immigration enforcement rhetoric and policy.
1994–1995: Proposition 187
Anti-Latino hate crimes jumped 51.8 percent from 340 in 1994 to 516 in 1995 — the largest single-year increase in the category outside 2020–2021. The elevated band visible in the heat map’s 1995–96 rows correspond precisely with California’s Proposition 187 (passed November 1994). The parallel to the 2016–2019 escalation is direct: both produced broadly elevated monthly floors rather than single-event spikes.
Anti-Muslim Hate Crime: Three Defining Spikes Across 25 Years
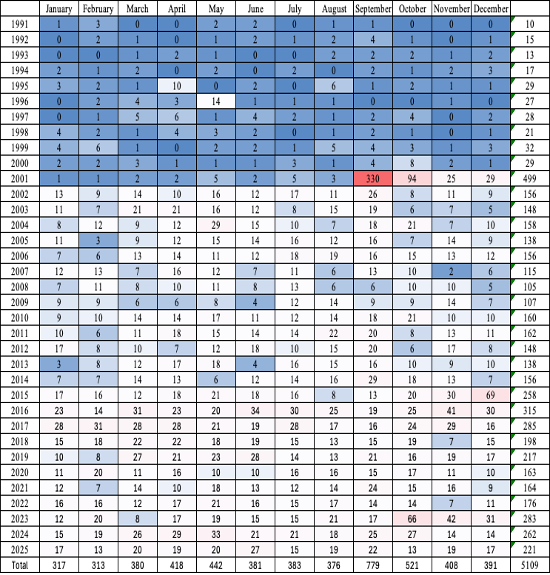
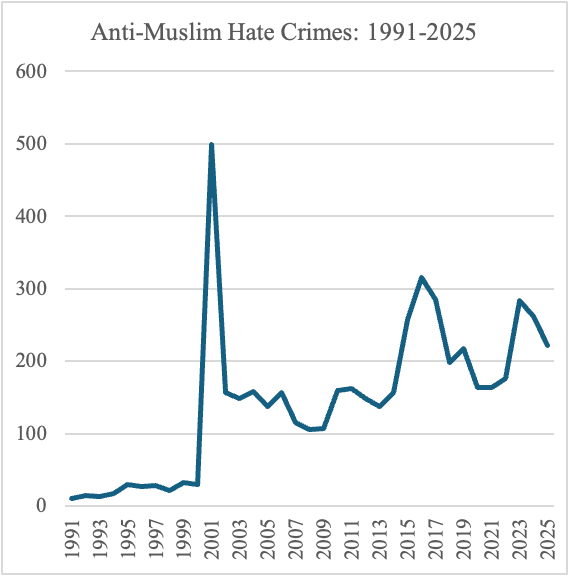
Figure 7: Anti-Muslim monthly heat map. Cells: Sept 2001 = 330, Oct 2001 = 94, Dec 2015 = 69. Source: FBI Crime Data Explorer.
The history of anti-Muslim hate crime is defined by three significant spikes. September 2001 reached 330 — the most statistically extreme single-month spike in any subcategory in the entire dataset. A December 2015 spike reached 69 following the Paris attacks, San Bernardino shooting, and Trump’s proposed Muslim ban. October 2023, came close, reaching 66 following October 7.
Anti-Muslim incidents declined 15.6 percent from 262 in 2024 to 221 in 2025, continuing a gradual moderation from the October 7–driven peak of 283 in 2023. The pattern mirrors what occurred after the 2001 and 2015 spikes: a sharp elevation followed by multi-year receding that nonetheless leaves the baseline above its pre-spike level. Monthly figures now stabilize at 13–33, still 58 percent above the 34-year annual average of 140.
Anti-Asian Hate Crime: A Pandemic Spike That Has Not Fully Receded
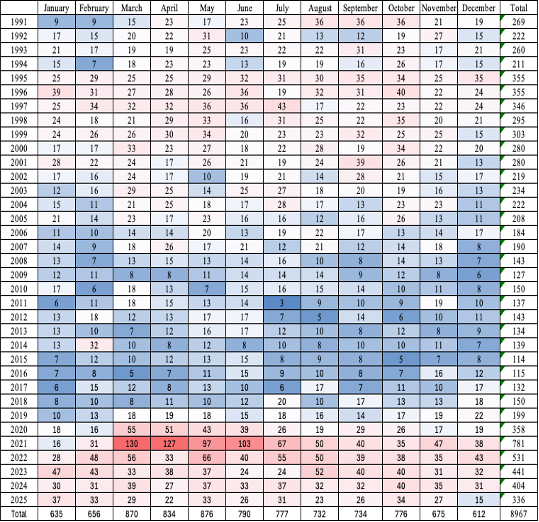
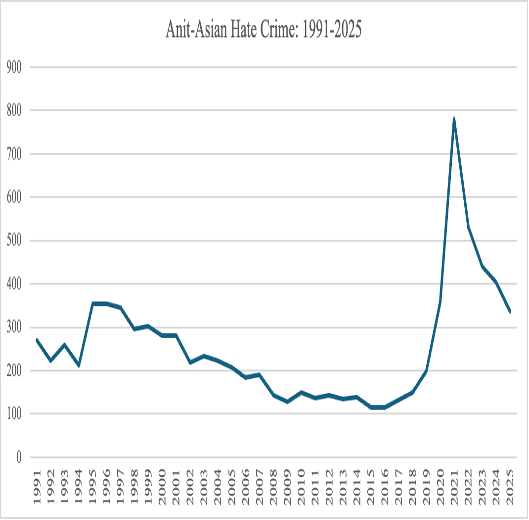
Figure 8: Anti-Asian monthly heat map. 2021 peak outlier cells. Source: FBI Crime Data Explorer.
Anti-Asian hate crime rose from 114 in 2015 to 336 in 2025, a 195 percent increase. Monthly incidents rose from 15 in February 2020 to 55 in March 2020 as COVID-19 racial scapegoating spread and racial political stereotyping increased. The most dramatic surge came in March and April 2021— after COVID hospitalizations increased early in the year and debate about the vaccine rollout intensified, followed by the horrific Atlanta spa shootings on March 16, in which six Asian women were murdered.
Anti-Asian incidents fell 16.8 percent from 404 in 2024 to 336 in 2025, extending the post-2021 receding trend now in its fourth consecutive year. The 2025 total is 57 percent below the 2021 peak of 781, though still 203 percent above the 2015 baseline of 111 — a significant structural elevation from the pre-pandemic norm that has not reversed.
Anti-Sikh Hate Crime: A New All-Time Record with a Late-Year Surge
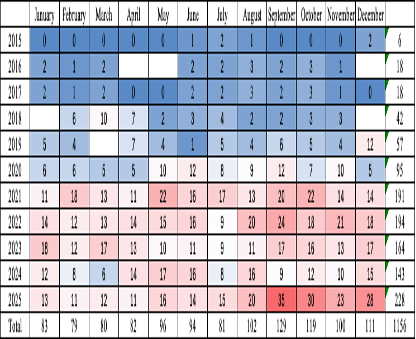
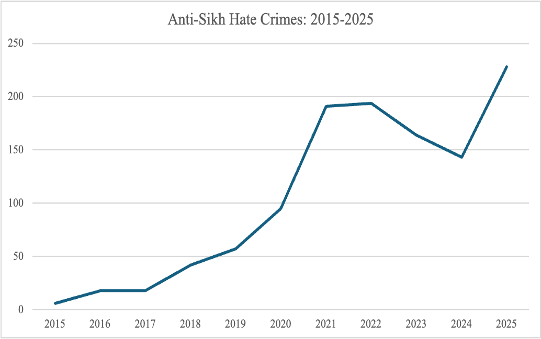
Figure 9: Anti-Sikh monthly heat map, 2015–2025. Source: FBI Crime Data Explorer.
Anti-Sikh hate crime reached an all-time record of 228 incidents in 2025, up from just 6 in 2015 – it should be noted that 2015 is an outlier year as it was the first for anti-Sikh data collection, when reports are typically very low. The heat map shows a dramatic concentration in the final four months: September (35), October (30), November (23), and December (28) together accounted for 116 of the year’s 228 incidents — more than half in four months. The worst anti-Sikh attack that eventually left seven dead in Wisconsin took place in 2012, prior to the category being broken out in data.
The 2024-to-2025 change was the largest annual percentage increase of any tracked larger category: anti-Sikh incidents surged 59.4 percent from 143 in 2024 to 228 in 2025, a decade record. The jump is all the more striking because 2024 was itself below the prior three-year average. The concentration of more than half the year’s incidents in the final four months suggests an emerging acute threat pattern rather than a broadly distributed elevation, possibly tied to anti-immigrant sentiment.
2017–2018: The Post-Charlottesville Surge
The heat map shows a previously undocumented annual jump: anti-Sikh hate crimes more than doubled from 18 in 2017 to 42 in 2018 (+133%), following the post-Charlottesville white nationalist surge of August 2017. Anti-Sikh attacks consistently rise during periods of elevated anti-Muslim sentiment, as Sikh Americans are frequently misidentified as Muslim due to turbans and beards. Recent gains are also probable in part to increased reporting efficiencies.
Sexual Orientation and Gender Identity: Sustained Targeting
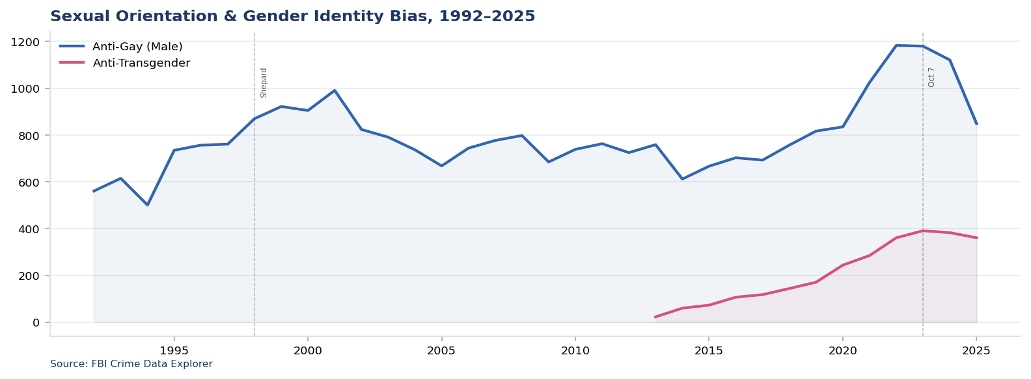
Figure 10: Anti-Gay (Male) and Anti-Transgender bias incidents, 1992–2025.
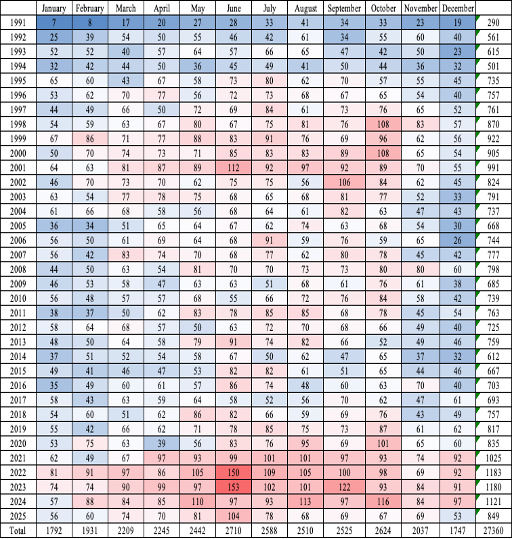
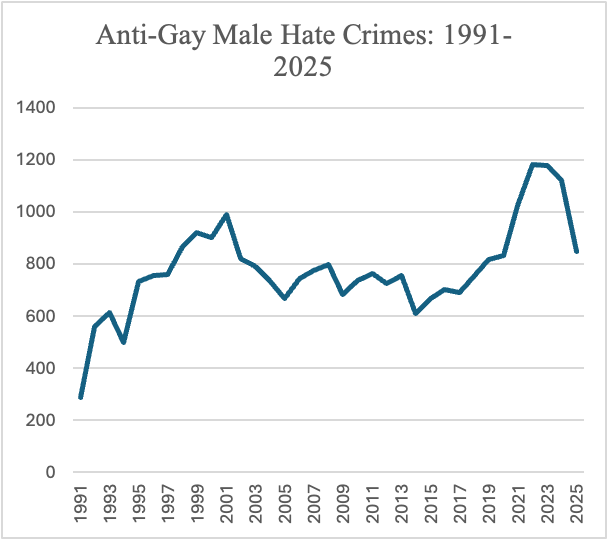
Figure 11: Anti-Gay (Male) monthly heat map. Source: FBI Crime Data Explorer.
Anti-Gay (Male) incidents rose from 664 in 2015 to 849 in 2025. The heat map shows a consistent June elevation — a Pride Month pattern — with June 2022 (150) and June 2023 (153) the two highest months in the series. In June 2016 49 people were killed in an anti-Gay massacre at the Pulse night club in Orlando, FL by a religious extremist. October, 1998 stands above threshold – the month of the murder of Matthew Shepard, whose nationally reported killing correlated to a measurable national hate crime uptick. The annual total declined from peaks of 1,180 in 2023 and 1,121 in 2024 to 849 in 2025.
Anti-Gay (Male) incidents declined 24.3 percent from 1,121 in 2024 to 849 in 2025 — the sharpest single-year percentage decline in the category’s history. Despite the moderation, 849 is still 11 percent above the 34-year annual average of 767, and the June 2025 monthly total of 104 confirms the Pride Month elevation pattern remains active.
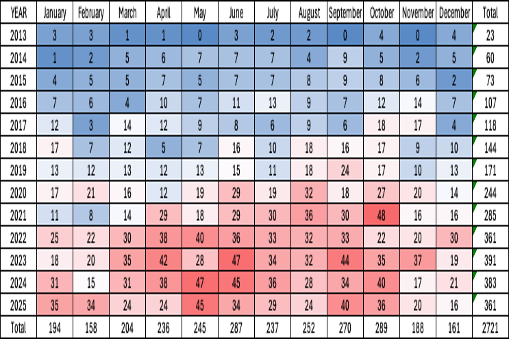
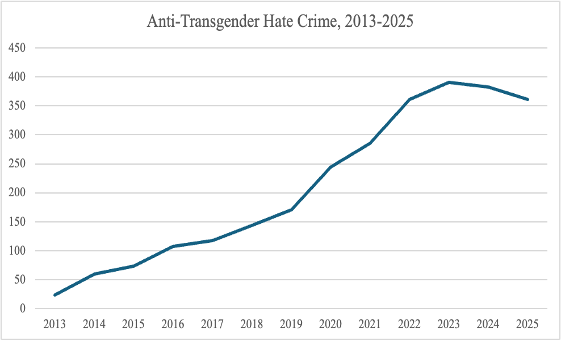
Figure 12: Anti-Transgender monthly heat map, 2013–2025. Source: FBI Crime Data Explorer.
Anti-Transgender hate crime rose from 73 in 2015 to 361 in 2025 — a 395 percent increase, 98 percent above the 13-year annual average of 182. The heat map shows October 2021 as the period’s single highest month, coinciding with a record wave of 27 anti-LGBTQ+ bills enacted into law in 2021. The Human Rights Campaign documented 2021 as the deadliest year on record for fatal anti-transgender violence (57 deaths).
Anti-Transgender incidents declined a modest 5.7 percent from 383 in 2024 to 361 in 2025. The category has now posted three consecutive years above 360 — 2023 (391), 2024 (383), 2025 (361) — representing a sustained plateau well above the pre-2020 norm. Despite slight moderation, 2025 remains 98 percent above the 13-year annual average, consistent with structural elevation tied to the continued political targeting of transgender people in legislation and public discourse.
Anti-Catholic Hate Crime Up, But Below 2022 Record
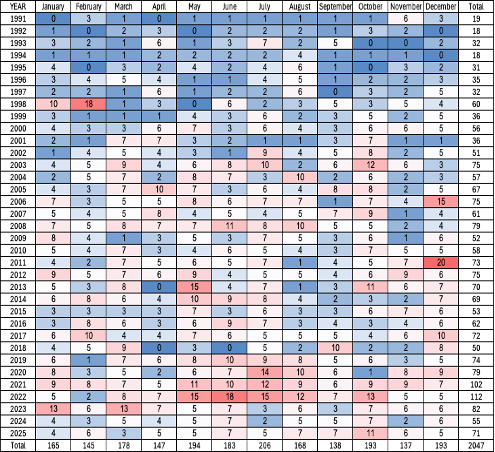
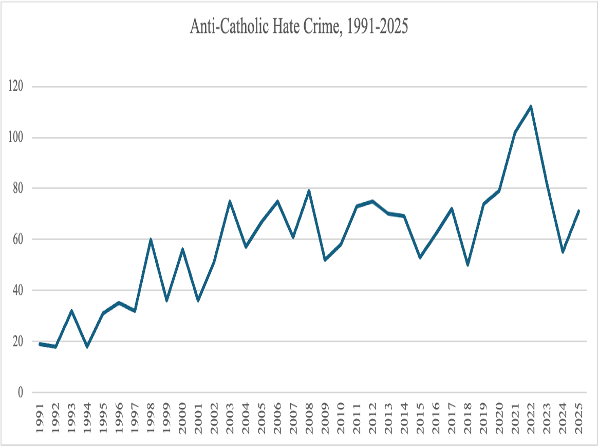
Catholicism, the largest single faith in the United States saw hate crime rise from 55 to 71 or 29 percent from 2024 and 34 percent from 2015. The category remains 37 percent below its 2022 peak of 112.
The Scale of Underreporting
The FBI police data reflect only incidents reported to and correctly identified by participating law enforcement. The National Crime Victimization Survey (NCVS) estimates hate crime victimization at 200,000–300,000 per year — 20 to 30 times the FBI figure. California Health Interview Survey (CHIS) data indicate roughly 649,000 Californians experienced criminal-level hate incidents in a single annual survey period. FBI statistics are an indicator of confirmed trends, not a comprehensive measure of the full burden of bias-motivated harm. Police data is far more effective at identifying trends than it is actual volume, which it vastly undercounts
Conclusion: A Floor, Not a Ceiling
The FBI hate crime data for 2015 through 2025, enriched by monthly figures going back to 1991, document a decade of extraordinary harm and a pattern of lengthy event-driven escalation that has permanently raised the national baseline. Anti-Latino and anti-Sikh hate crime both reached annual records in 2025. Anti-Black crimes are two thirds higher than ten years ago. Anti-Jewish incidents remain more than double pre-2022 norms despite the largest single-year decline on record. Anti-Transgender hate crime is 98 percent above its 13-year average. The 2024-to-2025 moderation in overall totals is real but partial: a split across categories, with three rising to records while others receded from their post-October 7 peaks. With no significant national elections and a temporary de-escalation in some international conflicts, 2025 may constitute a pause, before a possible rise in hate crime for 2026 when geo-political conflicts and election seasons resume.
The newly identified correlations here deepen our understanding of how political environments and catalyzing events drive the data. Reading these crime statistics correctly means treating them as a floor, not a ceiling, and looking at multi-year trends and the catalysts that drive them.
Sources: FBI Crime Data Explorer (1991–2025); Bureau of Justice Statistics, NCVS; California Health Interview Survey (CHIS); Sikh Coalition (2019); Human Rights Campaign Epidemic of Violence Reports; Center for the Study of Hate and Extremism, Cal State San Bernardino; NBC News analysis (2018).
Authors: Brian Levin, JD, is professor emeritus of Criminal Justice at California State University, San Bernardino
James Nolan, PhD, is a professor emeritus in Sociology from West Virginia University and former head of the FBI’s statistical unit for hate crime analysis
McKenna Lausch is a sophomore at Westtown School in Pennsylvania
Darrell Claybrook is a senior at Fairmont Senior High School Fairmont WV
Data note: The FBI data presented here came from their CDE data portal and will be refreshed when final numbers are released later this year. Some data will likely change as more agencies file and other data is filtered. Some data in heat maps does not represent annual totals and there are minor inconsistencies between different FBI data sets featured here, as some are dynamic and frequently updated while others are more fixed.
Sources:
FBI Crime Data Explorer https://cde.ucr.cjis.gov/LATEST/webapp/#/pages/explorer/crime/hate-crime
Arizona UCR https://azcrimestatistics.azdps.gov/tops/report/hate-crime/phoenix-pd/2026
Chicago Police Hate Crime: https://www.chicagopolice.org/statistics-data/data-dashboards/hate-crime-dashboard/
Colorado Hate Crimes Statistics https://coloradocrimestats.state.co.us/tops/report/hate-crime/colorado/2026
Council on Criminal Justice https://counciloncj.org/crime-trends-in-u-s-cities-year-end-2025-update/
LAPD Hate Crime Data https://www.lapdonline.org/office-of-the-chief-of-police/office-of-special-operations/detective-bureau/detective-support-and-vice-division/hate-crimes/
NCVS https://catalog.data.gov/dataset/national-crime-victimization-survey-ncvs-series-aca9d
Nevada Crime Statistics: https://nevadacrimestats.nv.gov/tops/report/hate-crime/las-vegas-metro-police-department/2026
NYPD Hate Data https://www.nyc.gov/site/nypd/news/PR006/nypd-fewest-murders-shooting-incidents-recorded-history-first-three-months-the
Pennsylvania UCR https://www.ucr.pa.gov/PAUCRSPUBLIC/Report/HateCrimeByORIReport
Texas UCR https://txucr.nibrs.com/Report/HateCrime
UCLA- CHIS Hate Crime Survey https://healthpolicy.ucla.edu/our-work/publications/experiences-hate-california-2023-2024